By Francois van der Merwe, Portfolio Manager at Absa Multi-Management
We are living in extraordinary times. The United States (US) economic expansion is now the longest in history, the US president can move markets with a Tweet, de-globalisation is taking hold, populism is rising and a record amount of global bonds are trading at negative yield. The investment landscape has become just as murky. Stocks, especially in the US, are up double digits for the year-to-date and trading at eye-watering lofty valuation levels on the back of buoyant investor sentiment and interest rate cut expectations. At the same time, market commentators are warning that the more than $12 trillion of negative yielding bonds (see graph below) and a yield curve inversion in the US are all distress signals pointing towards imminent global recession. How does one make sense of these conflicting signals and navigate this difficult environment?
Global Market Capitalisation of Negative Yielding Debt
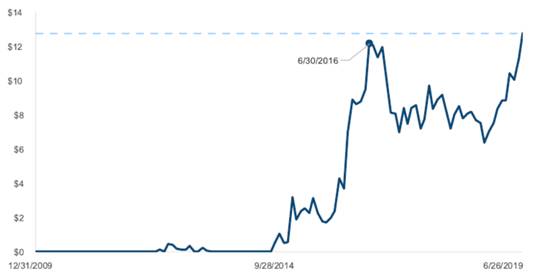
Source: Bloomberg Global Aggregate Negative Yielding Debt Index
Having a globally diversified portfolio with exposure to best in class investment managers and different asset classes is a good starting point. Understanding how these managers invest and what investment style you are exposed to is critical. Know the pitfalls of passive investing and the shortcomings of index construction (i.e. fixed interest indices are skewed towards the largest borrowers) and understand the risks that you take. Risk has various definitions and meanings to different investors. Sometimes it is meant to describe the volatility of returns (or standard deviation thereof), other times it is viewed as the permanent loss of capital. Importantly, it should also be viewed as the failure to meet a desired outcome over a specified time horizon. Investors should be careful not to chase past best performance, and be aware that previously defensive portfolio strategies might not be as effective in this market cycle.

Active management
When investing with active managers, one’s portfolio will look drastically different and will frequently incur more volatility than the index. Sometimes, it will mean short-term underperformance. However, this differentiation will provide these managers with the opportunity to add value over the long term. Active managers that follow fundamental research will typically invest in businesses that they believe the market often does not fully understand. The resulting share-price variation is usually driven by a multitude of shorter-term investors changing their mind about an asset whose intrinsic value is not really changing at all. In this instance, volatility is not a risk but it creates opportunity for long-term investors that are willing to take the calculated risk believing that they will be compensated for it. It is the multi manager’s role to ensure that active managers are blended together in a complemented manner to ensure one manager’s short-term underperformance is potentially countered by another one’s outperformance, and that both provide long-term outperformance.
Volatility
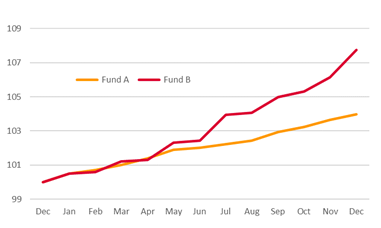
Volatility measures an asset’s price fluctuation over time. An investor with a holding period of less than a year and a half is almost certainly ignoring what matters for the underlying businesses over the longer term. Stock prices change far more frequently than a business’s true structural opportunity. It is thus important for active managers to be able to take long-term positions. Tolerating volatility can generously compensate patient investors over the long term. Investors should also differentiate between positive and negative return volatility, i.e. large swings in returns when these movements are negative and large swings in positive returns. The former being undesirable in all instances, while the latter is acceptable for a long-term investor who wants outsized returns. This is evident in the graph above where Fund B would be considered more volatile than Fund A, but this is due to volatility in positive returns. A different way of assessing a fund’s return profile would be to decompose it into upside and downside capture to a relevant index. This will provide a better understanding of how a manager performs in different market environments.
Opportunity Cost
Opportunity cost is also a very real and costly risk to investors. In 2019, the US equity market (as measured by the S&P 500 Index) posted its best first half in 20 years, but many investors missed out on these gains, as indicators of investment sentiment observed some of the most bearing investor confidence since the Global
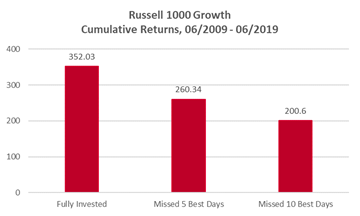
Source: Factset
Financial Crisis. This is further echoed by US equities having posted 40 straight quarters of institutional outflows despite the longest bull market on record. One way opportunity cost materialises is the instinct to avoid businesses with high, perceived “risk” (volatility) or high valuations, but this often ignores business fundamentals and longer-term opportunities. Often the best days for stock returns occur within two weeks of the worst, and over time, missing those best days can hurt. The chart above shows that missing even the 10 best days can almost halve an investor’s return. Sixty percent of the best 10 days occurred within two weeks of the 10 worst days. While it is never enjoyable to experience the pain of stock price declines, investors should maintain a long-term investment approach that helps them resist the temptation of trying to time the market.
Investment Style
Confounding the difficult investment landscape even further is the selection of investment management styles that investors have to choose. From “deep value” investment, where stocks are bought at what is deemed to be a significant discount to their calculated intrinsic value in sometimes un-loved companies, through “growth” investment where companies are bought in the expectation that their earnings growth will be above market average. Another investment style that has grown in popularity is “quality”. Quality criteria can vary among investment managers and can range from soft measures (the quality of the company’s management, economic moat) to hard criteria (balance sheet strength, low debt levels, high returns on invested capital, stability of earnings, free cash flow generation).
If ever there was an environment that favoured safety and certainty, this would be it. Disruption-free, quality, visible growth and defensiveness are all characteristics investors want and have been willing to pay for. As a result, they have rushed headfirst into businesses that have these characteristics – or appear to, anyway. This has resulted in both the “quality” and “growth” styles of investing having had good returns over recent years. The low interest rate environment, that has lifted the present value of future dividend streams and made companies with strong earnings growth seem to be more valuable, also helped in this bull run. In contrast, “value” investing has underperformed severely. The outperformance of growth versus value has now gone on for almost 10 years and is now the longest stretch of outperformance that can be reasonably measured.
Value versus Growth
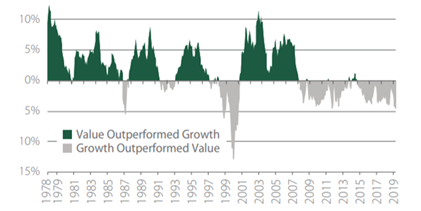
Source: Artisan Partners. As of 30 June 2019. Three-year rolling returns, MSCI AC World Growth Index vs MSCI AC World Value Index.
A rising tide of doomsayers have said that the current underperformance of value versus growth is a repeat of the excesses that were witnessed at the end of the 1990’s with the dot-com boom, where information technology shares have once again led the market to unsustainable valuation levels. However, there are some big differences. Many of the current tech companies have dominant platforms and are global champions. They trade at high return on invested capital (ROICs) and companies with high ROICs justify trading at higher price to earnings (PE) as it is easier for these companies to grow their future earnings than what it is for low ROIC companies. Hence, it is also important to understand that PE ratios alone do not tell us whether one company is cheaper than the other one. There are additional statistics that prove the current technology boom is different to the dot-com one. They include the median age of tech initial public offerings (IPOs) that has risen from four to 12 years and the median sales of tech IPOs that has increased more than threefold. This means that the tech companies that are going to the stock market for capital raising are real companies that have developed robust, viable and innovative business models.

